Table of Contents
nomad autoscaler 가지고 놀기
목표
nomad autoscaler 를 이용해 Auto Scaling 을 작동시킵니다.
준비물 설치
AWS AMI 인스턴스를 생성합니다.
메모리는 2G 로 합니다.
JDK, Docker 를 설치합니다.
sudo yum install java-11-amazon-corretto-headless -y
java -version
sudo yum install docker -y
docker -v
sudo service docker start
sudo systemctl enable docker.serviceConsul 설치
sudo mkdir -p /etc/consul.d
sudo mkdir -p /opt/consul

sudo vi /etc/consul.d/consul.hcl
-----------------------------------------
datacenter       = "dc1"
advertise_addr   = "127.0.0.1"
client_addr      = "0.0.0.0"
data_dir         = "/opt/consul"
server           = true
bootstrap_expect = 1
ui               = true

telemetry {
  prometheus_retention_time = "30s"
}
-----------------------------------------
sudo docker run -d --name consul \
-p 8500:8500 -p 8600:8600 -p 8600:8600/udp \
-v /opt/consul:/opt/consul \
-v /etc/consul.d:/etc/consul.d \
--net host \
--restart=always \
consul:1.4.2Nomad 설치
아래 명령으로 nomad 를 설치해 줍니다.
wget https://releases.hashicorp.com/nomad/1.1.3/nomad_1.1.3_linux_amd64.zip
unzip nomad_1.1.3_linux_amd64.zip
sudo mv nomad /usr/bin/

nomad version
테스트용이므로, 한 서버에 Server/Client 를 한번에 활성화 합니다.
sudo mkdir -p /etc/nomad.d
sudo mkdir -p /opt/nomad

sudo vi /etc/nomad.d/nomad.hcl
-----------------------------------------
datacenter = "dc1"
data_dir   = "/opt/nomad/data"
bind_addr  = "0.0.0.0"

advertise {
  http = "{{ GetPrivateIP }}"
  rpc  = "{{ GetPrivateIP }}"
  serf = "{{ GetPrivateIP }}"
}

server {
  enabled          = true
  bootstrap_expect = 1
}

client {
  enabled = true

  host_volume "grafana" {
    # add directory manually
    # sudo mkdir -p /opt/nomad-volumes/grafana
    # sudo chown 472:472 /opt/nomad-volumes/grafana
    path = "/opt/nomad-volumes/grafana"
  }
}

# plugin "nvidia-gpu" {
#   config {
#     enabled            = true
#     ignored_gpu_ids    = ["GPU-fef8089b", "GPU-ac81e44d"]
#     fingerprint_period = "1m"
#   }
# }

plugin "docker" {
  config {
    volumes {
      enabled = true
    }
  }
}

telemetry {
  publish_allocation_metrics = true
  publish_node_metrics       = true
  prometheus_metrics         = true
}
-----------------------------------------
grafana 용 볼륨 생성
sudo mkdir -p /opt/nomad-volumes/grafana
sudo chown 472:472 /opt/nomad-volumes/grafana
nomad client 는 root 권한이 필요합니다.
sudo nomad agent -config=/etc/nomad.d/nomad.hclnomad 서비스로 실행하기
sudo vi /lib/systemd/system/nomad.service
---------------------------
[Unit]
Description=Nomad
Documentation=https://nomadproject.io/docs/
Wants=network-online.target
After=network-online.target

# When using Nomad with Consul it is not necessary to start Consul first. These
# lines start Consul before Nomad as an optimization to avoid Nomad logging
# that Consul is unavailable at startup.
#Wants=consul.service
#After=consul.service

[Service]
ExecReload=/bin/kill -HUP $MAINPID
ExecStart=/usr/bin/nomad agent -config /etc/nomad.d
KillMode=process
KillSignal=SIGINT
LimitNOFILE=65536
LimitNPROC=infinity
Restart=on-failure
RestartSec=2
StartLimitBurst=3
StartLimitIntervalSec=10
TasksMax=infinity
OOMScoreAdjust=-1000

[Install]
WantedBy=multi-user.target
---------------------------
sudo systemctl daemon-reload
sudo systemctl enable nomad
sudo systemctl start nomad
sudo systemctl status nomadTraefik 설치
Traefik 이 CPU 과다 사용 이슈가 있어 HAproxy 로 변경합니다.
Reverse Proxy 를 위해 traefik 을 설치합니다.
vi traefik.nomad
------------------------------
job "traefik" {
  region      = "global"
  datacenters = ["dc1"]
  type        = "system"

  group "traefik" {
    count = 1

    network {
      # traefik web ui
      port "api" {
        static = 8081
      }

      port "grafana" {
        static = 3000
      }

      port "prometheus" {
        static = 9090
      }

      port "http" {
        static = 8080
      }
    }

    task "traefik" {
      driver = "docker"

      config {
        image = "traefik:v2.4"
        ports = ["api", "grafana", "prometheus", "http"]

        # Use `host` network so we can communicate with the Consul agent
        # running in the host to access the service catalog.
        network_mode = "host"

        volumes = [
          "local/traefik.toml:/etc/traefik/traefik.toml",
        ]
      }

      template {
        data = <<EOF
[entryPoints]
  [entryPoints.traefik]
    address = ":{{ env "NOMAD_PORT_api" }}"
  [entryPoints.grafana]
    address = ":{{ env "NOMAD_PORT_grafana" }}"
  [entryPoints.prometheus]
    address = ":{{ env "NOMAD_PORT_prometheus" }}"
  [entryPoints.http]
    address = ":{{ env "NOMAD_PORT_http" }}"
[api]
  dashboard = true
  insecure  = true
[metrics]
  [metrics.prometheus]
    addServicesLabels = true
# Enable Consul Catalog configuration backend.
[providers.consulCatalog]
  prefix           = "traefik"
  exposedByDefault = false
  [providers.consulCatalog.endpoint]
    address = "127.0.0.1:8500"
    scheme  = "http"
EOF

        destination = "local/traefik.toml"
      }

      resources {
        cpu    = 200
        memory = 256
      }

      service {
        name         = "traefik-api"
        port         = "api"
        address_mode = "host"

        check {
          name     = "alive"
          type     = "tcp"
          port     = "api"
          interval = "10s"
          timeout  = "2s"
        }
      }

      service {
        name         = "traefik-http"
        port         = "http"
        address_mode = "host"

        check {
          name     = "alive"
          type     = "tcp"
          port     = "http"
          interval = "10s"
          timeout  = "2s"
        }
      }

      service {
        name         = "traefik-grafana"
        port         = "grafana"
        address_mode = "host"

        check {
          name     = "alive"
          type     = "tcp"
          port     = "grafana"
          interval = "10s"
          timeout  = "2s"
        }
      }

      service {
        name         = "traefik-prometheus"
        port         = "prometheus"
        address_mode = "host"

        check {
          name     = "alive"
          type     = "tcp"
          port     = "prometheus"
          interval = "10s"
          timeout  = "2s"
        }
      }
    }
  }
}
------------------------------
nomad run traefik.nomadHAproxy 설정
앱의 DNS 만 매칭해 주면 됩니다.
대소문자는 구분하지 않습니다.
_<앱의 서비스명>._tcp.service.consul
vi haproxy.nomad
------------------------------
job "haproxy" {
  datacenters = ["dc1"]

  group "haproxy" {
    count = 1

    network {
      port "webapp" {
        static = 8080
      }

      port "prometheus_ui" {
        static = 9090
      }

      port "grafana_ui" {
        static = 3000
      }

      port "haproxy_ui" {
        static = 4936
      }

      port "haproxy_exporter" {}
    }

    task "haproxy" {
      driver = "docker"

      config {
        image = "haproxy:2.3.5"
        ports = ["webapp", "haproxy_ui"]

        # Use `host` network so we can communicate with the Consul agent
        # running in the host to access the service catalog.
        network_mode = "host"

        volumes = [
          "local/haproxy.cfg:/usr/local/etc/haproxy/haproxy.cfg",
        ]
      }

      template {
        data = <<EOF
global
   maxconn 8192

defaults
   mode http
   timeout client 10s
   timeout connect 5s
   timeout server 10s
   timeout http-request 10s

frontend stats
   bind *:{{ env "NOMAD_PORT_haproxy_ui" }}
   stats uri /
   stats show-legends
   no log

frontend http_front
   bind *:{{ env "NOMAD_PORT_webapp" }}
   default_backend http_back

frontend prometheus_ui_front
   bind *:{{ env "NOMAD_PORT_prometheus_ui" }}
   default_backend prometheus_ui_back

frontend grafana_ui_front
   bind *:{{ env "NOMAD_PORT_grafana_ui" }}
   default_backend grafana_ui_back

backend http_back
   balance roundrobin
   server-template webapp 20 _helloservice._tcp.service.consul resolvers consul resolve-opts allow-dup-ip resolve-prefer ipv4 check

backend prometheus_ui_back
   balance roundrobin
   server-template prometheus_ui 5 _prometheus._tcp.service.consul resolvers consul resolve-opts allow-dup-ip resolve-prefer ipv4 check

backend grafana_ui_back
   balance roundrobin
   server-template grafana 5 _grafana._tcp.service.consul resolvers consul resolve-opts allow-dup-ip resolve-prefer ipv4 check

resolvers consul
   nameserver consul {{ env "attr.unique.network.ip-address" }}:8600
   accepted_payload_size 8192
   hold valid 5s
EOF

        destination   = "local/haproxy.cfg"
        change_mode   = "signal"
        change_signal = "SIGUSR1"
      }

      resources {
        cpu    = 500
        memory = 128
      }

      service {
        name = "haproxy-ui"
        port = "haproxy_ui"

        check {
          type     = "http"
          path     = "/"
          interval = "10s"
          timeout  = "2s"
        }
      }

      service {
        name = "haproxy-webapp"
        port = "webapp"
      }
    }

    task "haproxy-exporter" {
      driver = "docker"

      lifecycle {
        hook    = "prestart"
        sidecar = true
      }

      config {
        image = "prom/haproxy-exporter:v0.10.0"
        ports = ["haproxy_exporter"]

        network_mode = "host"

        args = [
          "--web.listen-address",
          ":${NOMAD_PORT_haproxy_exporter}",
          "--haproxy.scrape-uri",
          "http://${NOMAD_ADDR_haproxy_ui}/?stats;csv",
        ]
      }

      resources {
        cpu    = 100
        memory = 32
      }

      service {
        name = "haproxy-exporter"
        port = "haproxy_exporter"

        check {
          type     = "http"
          path     = "/metrics"
          interval = "10s"
          timeout  = "2s"
        }
      }
    }
  }
}
------------------------------
nomad run haproxy.nomadPrometheus 설정
vi prometheus.nomad
------------------------------
job "prometheus" {
datacenters = ["dc1"]
group "prometheus" {
count = 1
network {
port "prometheus_ui" {}
}
task "prometheus" {
driver = "docker"
config {
image = "prom/prometheus:v2.25.0"
ports = ["prometheus_ui"]
network_mode = "host"
args = [
"--config.file=/etc/prometheus/config/prometheus.yml",
"--storage.tsdb.path=/prometheus",
"--web.listen-address=0.0.0.0:${NOMAD_PORT_prometheus_ui}",
"--web.console.libraries=/usr/share/prometheus/console_libraries",
"--web.console.templates=/usr/share/prometheus/consoles",
]
volumes = [
"local/config:/etc/prometheus/config",
]
}
template {
data = <<EOH
---
global:
scrape_interval: 1s
evaluation_interval: 1s
scrape_configs:
- job_name: haproxy_exporter
static_configs:
- targets: [{{ range service "haproxy-exporter" }}'{{ .Address }}:{{ .Port }}',{{ end }}]
- job_name: nomad_autoscaler
metrics_path: /v1/metrics
params:
format: ['prometheus']
static_configs:
- targets: [{{ range service "autoscaler" }}'{{ .Address }}:{{ .Port }}',{{ end }}]
- job_name: nomad
metrics_path: /v1/metrics
params:
format: ['prometheus']
static_configs:
- targets: ['{{ env "attr.unique.network.ip-address" }}:4646']
EOH
change_mode = "signal"
change_signal = "SIGHUP"
destination = "local/config/prometheus.yml"
}
resources {
cpu = 100
memory = 256
}
service {
name = "prometheus"
port = "prometheus_ui"
check {
type = "http"
path = "/-/healthy"
interval = "10s"
timeout = "2s"
}
}
}
}
}
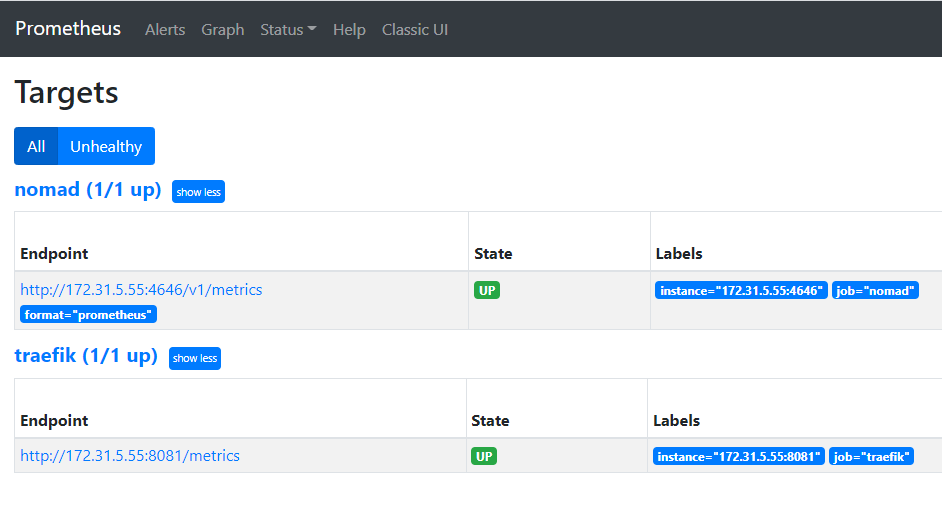
------------------------------nomad run prometheus.nomadhttp://<인스턴스 퍼블릭 아이피>:9090/targets 를 이용해 접속 상태를 확인할 수 있습니다.
Grafana 설정
vi grafana.nomad
-----------------------------------------
job "grafana" {
  datacenters = ["dc1"]

  group "grafana" {
    count = 1

    network {
      port "grafana_ui" {}
    }

    volume "grafana" {
      type   = "host"
      source = "grafana"
    }

    task "grafana" {
      driver = "docker"

      config {
        image = "grafana/grafana:7.4.2"
        ports = ["grafana_ui"]

        network_mode = "host"

        volumes = [
          "local/datasources:/etc/grafana/provisioning/datasources",
          "local/dashboards:/etc/grafana/provisioning/dashboards",
          "/home/vagrant/nomad-autoscaler/files:/var/lib/grafana/dashboards",
        ]
      }

      env {
        GF_INSTALL_PLUGINS         = "grafana-clock-panel,grafana-piechart-panel,natel-discrete-panel"
        GF_AUTH_ANONYMOUS_ENABLED  = "true"
        GF_AUTH_ANONYMOUS_ORG_ROLE = "Editor"
        GF_SERVER_HTTP_PORT        = "${NOMAD_PORT_grafana_ui}"
      }

      template {
        data = <<EOH
apiVersion: 1
datasources:
- name: Prometheus
  type: prometheus
  access: proxy
  url: http://{{ range $i, $s := service "prometheus" }}{{ if eq $i 0 }}{{.Address}}:{{.Port}}{{end}}{{end}}
  isDefault: true
  version: 1
  editable: false
EOH

        destination = "local/datasources/prometheus.yaml"
      }

      template {
        data = <<EOH
apiVersion: 1
providers:
- name: Nomad Autoscaler
  folder: Nomad
  folderUid: nomad
  type: file
  disableDeletion: true
  editable: false
  allowUiUpdates: false
  options:
    path: /var/lib/grafana/dashboards
EOH

        destination = "local/dashboards/nomad-autoscaler.yaml"
      }

      volume_mount {
        volume      = "grafana"
        destination = "/var/lib/grafana"
      }

      resources {
        cpu    = 100
        memory = 64
      }

      service {
        name = "grafana"
        port = "grafana_ui"

        check {
          type     = "http"
          path     = "/api/health"
          interval = "10s"
          timeout  = "2s"
        }
      }
    }
  }
}
-----------------------------------------
nomad run grafana.nomad환경변수 GF_INSTALL_PLUGINS 을 이용해 grafana 플러그인을 설치할 수 있습니다.
Autoscaler 생성
vi autoscaler.nomad
-----------------------------------------
job "autoscaler" {
  datacenters = ["dc1"]

  group "autoscaler" {
    count = 1

    task "autoscaler" {
      driver = "docker"

      config {
        image   = "hashicorp/nomad-autoscaler:0.3.3"
        command = "nomad-autoscaler"
        network_mode = "host"
        args    = ["agent", "-http-bind-port=8090", "-config", "${NOMAD_TASK_DIR}/config.hcl"]
      }

      template {
        data = <<EOF
plugin_dir = "/plugins"

nomad {
  address = "http://{{env "attr.unique.network.ip-address" }}:4646"
}
apm "nomad" {
  driver = "nomad-apm"
  config  = {
    address = "http://{{env "attr.unique.network.ip-address" }}:4646"
  }
}
apm "prometheus" {
  driver = "prometheus"
  config = {
    address = "http://{{ env "attr.unique.network.ip-address" }}:9090"
  }
}
strategy "target-value" {
  driver = "target-value"
}
          EOF

        destination = "${NOMAD_TASK_DIR}/config.hcl"
      }
    }
  }
}
-----------------------------------------
nomad run autoscaler.nomadhello 설정
vi hello.nomad
------------------------------
job "hello" {
datacenters = ["dc1"]
type = "service"
group "helloGroup" {
network {
port "http" {}
port "https" {}
# port "lb" { static = 8080 }
}
count = 1
scaling {
enabled = true
min = 1
max = 2
policy {
cooldown = "1m"
evaluation_interval = "30s"
check "avg_sessions" {
source = "prometheus"
query = "avg((haproxy_server_current_sessions{backend=\"http_back\"}) and (haproxy_server_up{backend=\"http_back\"} == 1))"
strategy "target-value" {
target = 5
}
}
}
}
# Define a task to run
task "helloTask" {
driver = "java"
config {
jar_path = "local/TestPublic-0.0.2-SNAPSHOT.jar"
jvm_options = ["-Xmx256m","-Xms256m"]
}
env {
PORT = "${NOMAD_PORT_http}"
NODE_IP = "${NOMAD_IP_http}"
}
service {
name = "helloService"
# port = "lb"
port = "http"
check {
type = "http"
path = "/hello" # health check 용 url
interval = "2s"
timeout = "2s"
}
}
resources {
cpu = 500 # 500 Mhz
memory = 500 # 500 MB
}
# 원격에서 다운받아야 합니다.
artifact {
source = "https://github.com/skyer9/TestPublic/raw/master/TestPublic-0.0.2-SNAPSHOT.jar"
}
}
}
}
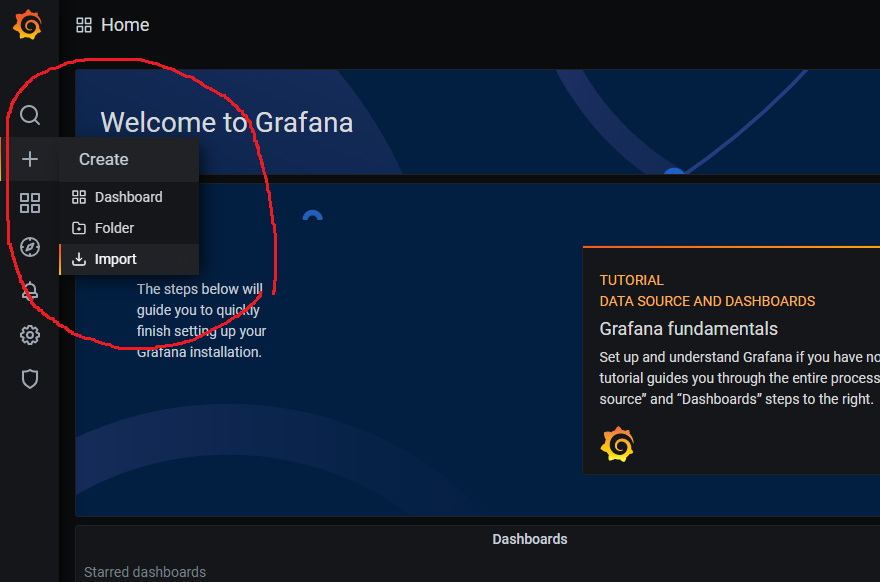
------------------------------nomad run hello.nomadGrafana 대시보드 추가
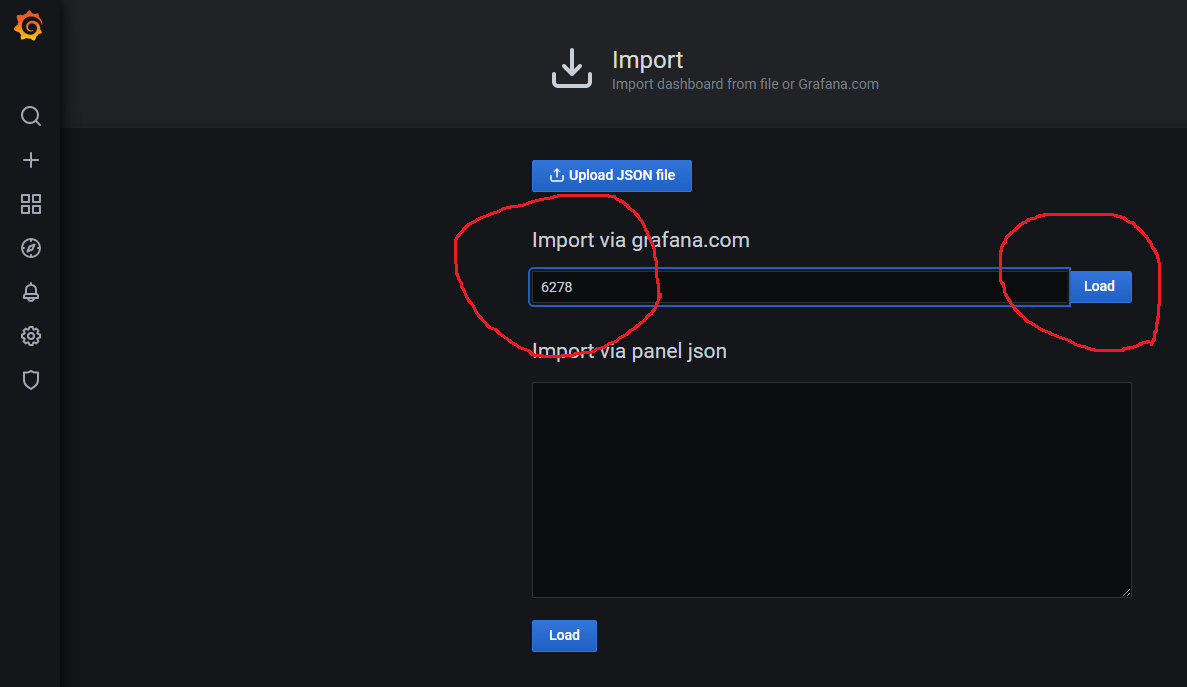
Nomad Cluster 대시보드 6278 을 설치합니다.
Nomad Jobs 대시보드 12787 을 추가합니다.
JVM (Micrometer) 대시보드 4701 을 추가합니다.
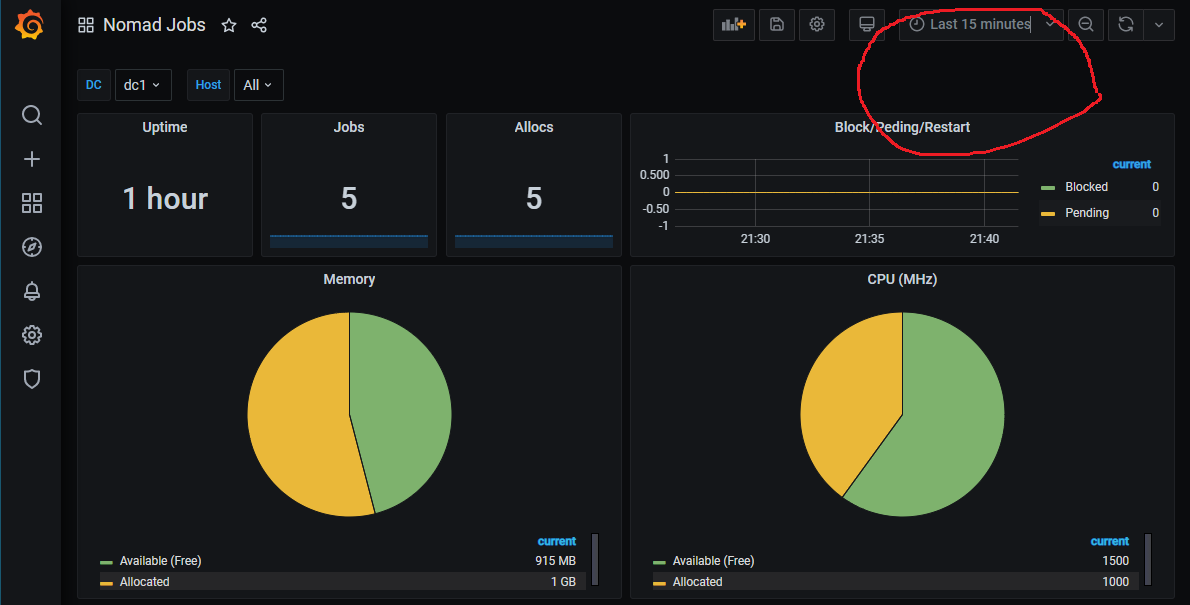
시간을 5분으로 변경해 줍니다.
스트레스 테스트 하기
wget https://hey-release.s3.us-east-2.amazonaws.com/hey_linux_amd64
chmod 777 hey_linux_amd64
sudo mv hey_linux_amd64 /usr/bin/hey

hey -help
5분간 200개의 동시 커넥션을 하도록 합니다.
hey -z 5m -c 200 http://localhost:8080/hello
댓글 테스트
Pingback: Nomad + Spring Boot App 권장 설정 – 상구리의 기술 블로그